6 minutes past 5 this evening:

(There was a problem with the publishing/privacy settings – maybe the tech team would like to post a comment saying what, exactly – that meant while the spreadsheet was viewable in preview form and as CSV, it was impossible to run Google visualisation API query language queries against it.)
Half an hour later:

And ten minutes after that:

So what? So this:

(That’s a test query using the Google visulisation API query language on the Shadow Cabinet expenses (via Google the Shadow Cabinet’s expenses).
And with a little tweaking, we can get a summary of the expenses by Shadow Cabinet member – run a select A,C,sum(E) group by A,C query on the spreadsheet:

(If you prefer to see the full total by member, use this query: select A,sum(E) group by A)
Now take the CSV output version of the query, pipe it into a Many Eyes Wikified dta page and plot it as an interactive tree map:

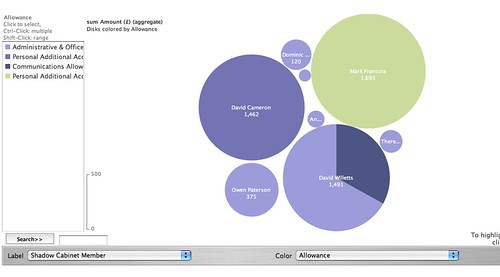
Or if you prefer a bubble chart?
Or maybe a matrix chart?

(I think that Many Eyes WIkified updates its data pages from live data feeds, so hopefully the linked to visualisation should remain pretty much up to date? [All the visulisations can be reached from this Many Eyes Wikified page.])
Isn’t this fun?:-) So why don’t you have a go?????
PS for a more comprehensive review of what’s possible with the query language, I’ve posted a wide selection of examples here: Using Google Spreadsheets as a Database with the Google Visualisation API Query Language.

3 thoughts on “And a Tweet Later – Querying Shadow Cabinet Expenses on Google Spreadsheets with the Google Query Language”
Comments are closed.