In Using Many Eyes Wikified to Visualise Guardian Data Store Data on Google Docs I showed how to pull data from Google spreadsheets (uploaded there by the Guardian as part of their Data Store initiative and visualise it using Many Eyes Wikified.
Unfortunately, one of the downsides of using Many Eyes Wikified is that you can’t filter the imported data or select subsets of rows from it (nor can you choose to just ignore particular columns in the visualisation editor – which would be a really handy thing to be able to do, and probably quite easy to implement?)
So for example, when looking at the RAE 2008 Data, it might be quite useful to be able to just visualise the data for a single institution, such as the Open University. But how can we do this?
One way would be to find a way of searching the data in the spreadsheet, and then only extracting the rows that contained the search term – such as “Open University” – in the institution name column. But I don’t know if that’s possible in Google Spreadsheets, (though it is possible in Zoho DB, which supports all manner of queries in SQL like dialects; but that’s for another day…;-).
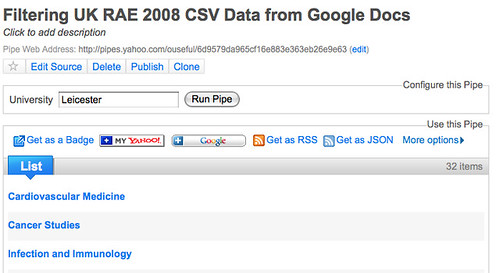
An alternative way is to grab the whole of the spreadsheet and then just filter out all the rows that don’t contain the filter term in the desired column… which is an idea that came into my mind last night on my way home, and which appears to work quite well, as this Filtering UK RAE 2008 CSV Data from Google Docs pipe shows:

If your pipe imported a CSV file, as this one does (in fact, if the items being pushed out of the pipe have a y:row attribute set giving a row/count number for each item) then you can get a CSV file out of the pipe too:

Which in this case means we can filter through just the RAE 2008 data for a particular institution, grab the CSV URL for that data, and pull it into Many Eyes wikified in the same way as described before:

Here it is:

And once we have a wiki data page for it, we can visualise it – I’ve popped some examples up here: OU RAE 2008 performance.
For example, how about a bubble diagram view showing our 4* performance across the various units of assessment:

(The number is the percentage of submissions in that unit of assessment achieving the specified grade.)
Or how about this one – an interactive bar chart showing the percentages of 3* and 4* submissions in each unit of assessment:

If you look back at the pipe interface, you’ll see you can use the same pipe to pull out the data for any of the HEIs:
The pipe output CSV URI also makes this clear:
http://pipes.yahoo.com/pipes/pipe.run?_id=6d9579da965cf16e883e363eb26e9e63&_render=csv&hei=Leicester
In the next post on this topic, I’ll show you how to create a rather more interesting RSS feed from this sort of pipe, including some Google chart URIs created dynamically within the pipe…
But for now, it’s time to go foraging for dinner…

Please note: It seems that Google has changed something. The …/tq/tqx=… has become very unstable, resulting in Access denied all the time.
Do this instead:
Choose to publish your spreadsheet to a webpage, copy the link to the webpage and change the &output=html to &output=csv. Like this:
http://spreadsheets.google.com/pub?key=xxxxxxxxxxxxxxxxxxxxxxx&single=true&gid=0&output=csv
Note the /pub.
I guess this means that Google’s had enough of people pollling spreadsheets constantly and now asks us to use a cached version instead?